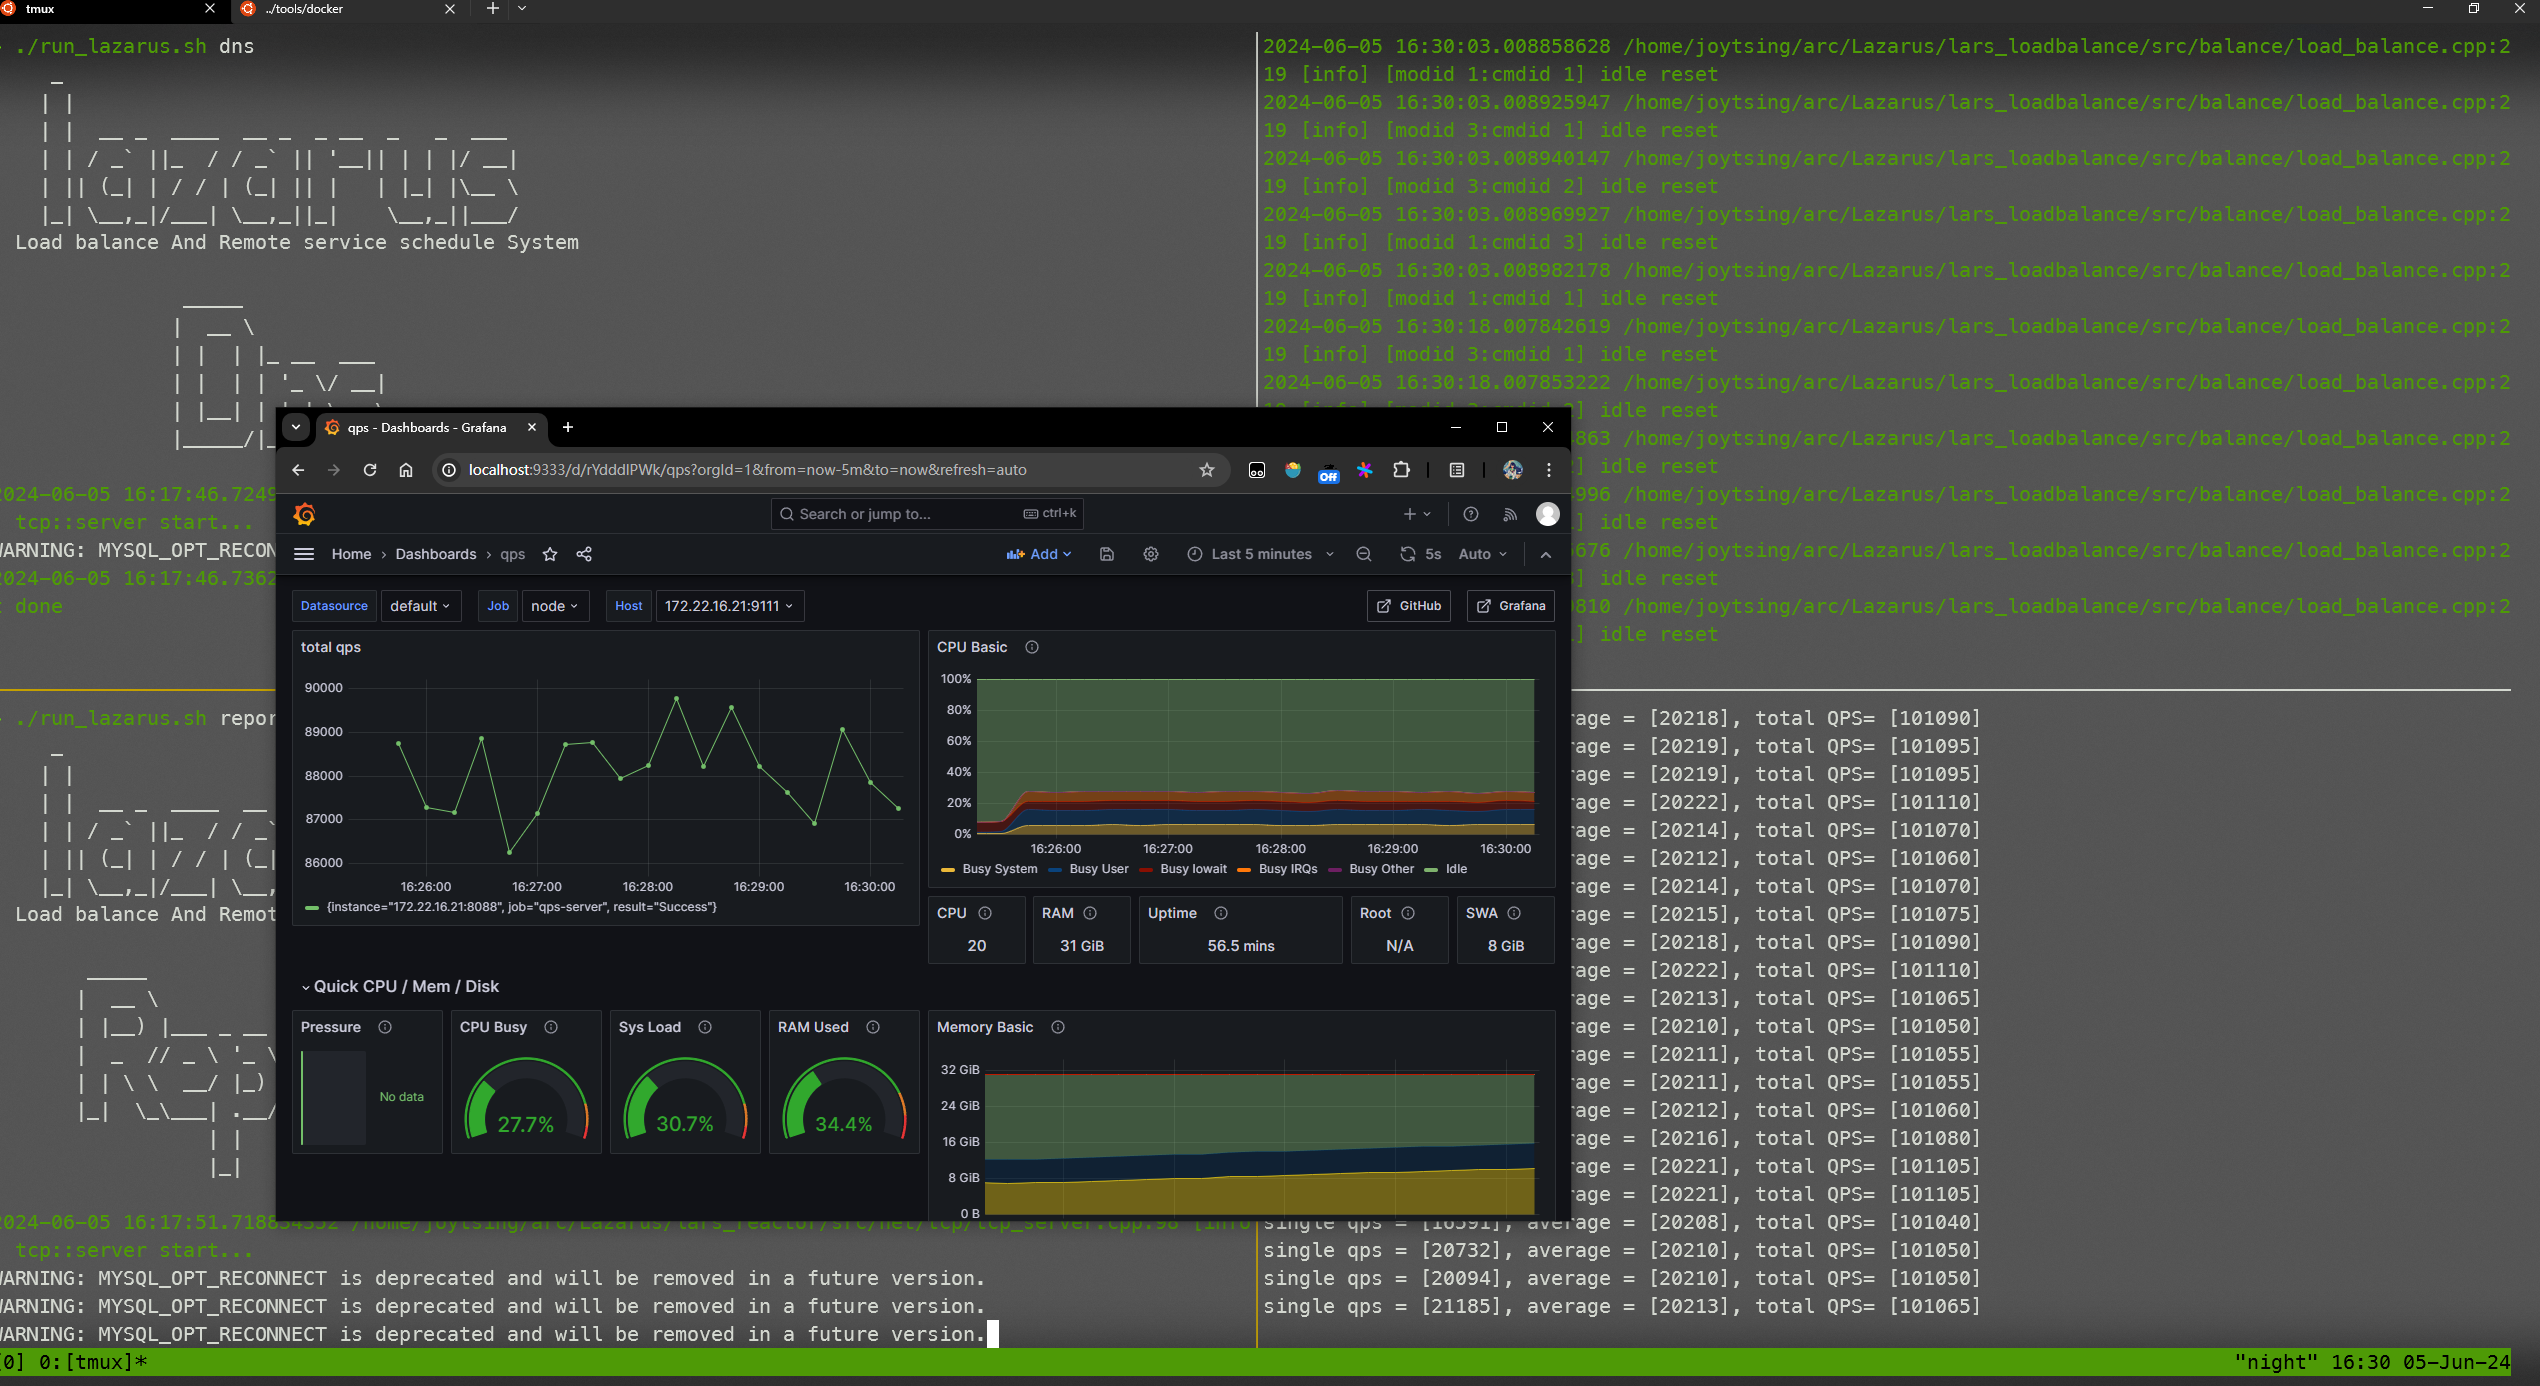
概述
监控是非常有必要的,就像打日志对于调试程序一样,日志打得好是可以避免手动gdb一行行排除错误的。同理对于评价一个程序,需要从各个方面的指标去评价,最常见也是最常用的就是QPS的监控了。
Prometheus
长话短说,这里用的是Prometheus Client Library for Modern C++,可以自己make install,不过官方提供了Ubuntu PPA源就直接用Ubuntu PPA源了,添加源后的安装readme里面没说,去ubuntu release看后知道名字叫prometheus-cpp-dev,直接安装即可。
#include <prometheus/counter.h>
#include <prometheus/exposer.h>
#include <prometheus/registry.h>

#include <array>
#include <chrono>
#include <cstdlib>
#include <memory>
#include <string>
#include <thread>

int main() {
  using namespace prometheus;

  // create an http server running on port 8080
  Exposer exposer{"127.0.0.1:8080"};

  // create a metrics registry
  // @note it's the users responsibility to keep the object alive
  auto registry = std::make_shared<Registry>();

  // add a new counter family to the registry (families combine values with the
  // same name, but distinct label dimensions)
  //
  // @note please follow the metric-naming best-practices:
  // https://prometheus.io/docs/practices/naming/
  auto& packet_counter = BuildCounter()
                             .Name("observed_packets_total")
                             .Help("Number of observed packets")
                             .Register(*registry);

  // add and remember dimensional data, incrementing those is very cheap
  auto& tcp_rx_counter =
      packet_counter.Add({{"protocol", "tcp"}, {"direction", "rx"}});
  auto& tcp_tx_counter =
      packet_counter.Add({{"protocol", "tcp"}, {"direction", "tx"}});
  auto& udp_rx_counter =
      packet_counter.Add({{"protocol", "udp"}, {"direction", "rx"}});
  auto& udp_tx_counter =
      packet_counter.Add({{"protocol", "udp"}, {"direction", "tx"}});

  // add a counter whose dimensional data is not known at compile time
  // nevertheless dimensional values should only occur in low cardinality:
  // https://prometheus.io/docs/practices/naming/#labels
  auto& http_requests_counter = BuildCounter()
                                    .Name("http_requests_total")
                                    .Help("Number of HTTP requests")
                                    .Register(*registry);

  // ask the exposer to scrape the registry on incoming HTTP requests
  exposer.RegisterCollectable(registry);

  for (;;) {
    std::this_thread::sleep_for(std::chrono::seconds(1));
    const auto random_value = std::rand();

    if (random_value & 1) tcp_rx_counter.Increment();
    if (random_value & 2) tcp_tx_counter.Increment();
    if (random_value & 4) udp_rx_counter.Increment();
    if (random_value & 8) udp_tx_counter.Increment();

    const std::array<std::string, 4> methods = {"GET", "PUT", "POST", "HEAD"};
    auto method = methods.at(random_value % methods.size());
    // dynamically calling Family<T>.Add() works but is slow and should be
    // avoided
    http_requests_counter.Add({{"method", method}}).Increment();
  }
  return 0;
}
docker-compose
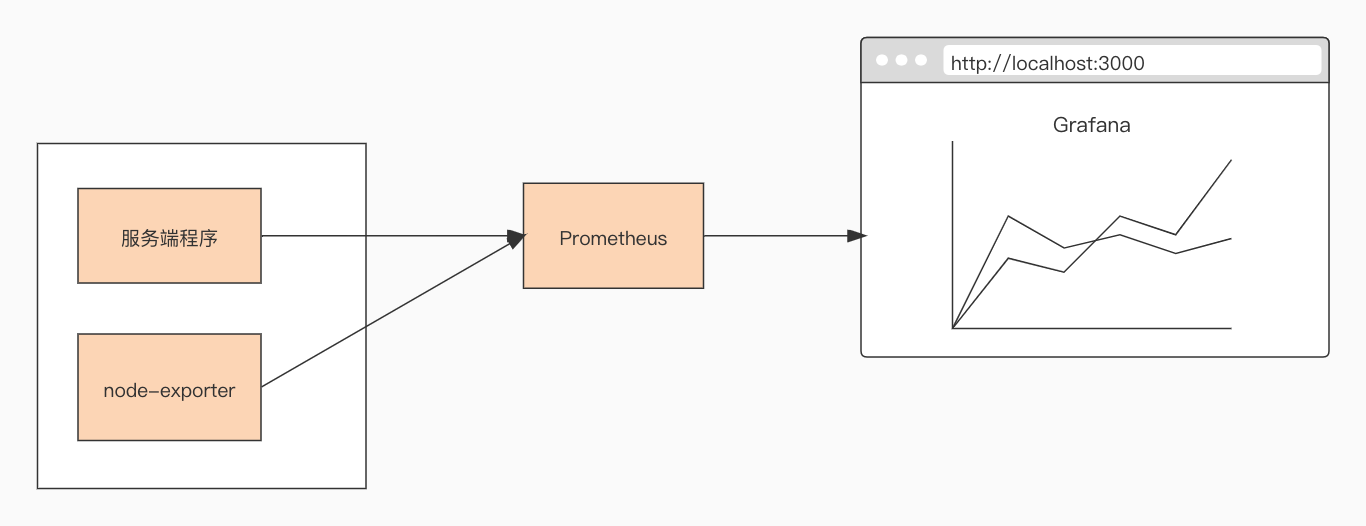
想要可视化我们的监控数据,我们还得启动Prometheus服务端,以及可视化的grafana工具,编写个docker-compose脚本拉取最新的就行, node_exporter用来帮助监控系统的数据。
services:
  prometheus:
    container_name: prometheus
    image: prom/prometheus:latest
    network_mode: "host"
    volumes:
      - prometheus_yml_path :/etc/prometheus/prometheus.yml
      - /etc/localtime:/etc/localtime
    ports:
      - "port1:9090"
    restart: on-failure

  grafana:
    container_name: grafana
    image: grafana/grafana:latest
    network_mode: "host"
    ports:
      - "port2:3000"
    restart: on-failure
    volumes:
      - /etc/localtime:/etc/localtime
      - ./data/grafana:/var/lib/grafana

  # linux node_exporter
  node_exporter:
    image: quay.io/prometheus/node-exporter:latest
    restart: always
    container_name: qps_node_exporter
    command:
      - '--path.rootfs=/host'
    ports:
      - "port3:9100"
    volumes:
- your_path然后去配置prometheus_yml
global:
  scrape_interval: 5s # Set the scrape interval to every 15 seconds. Default is every 1 minute.
  evaluation_interval: 10s # Evaluate rules every 15 seconds. The default is every 1 minute.
  # scrape_timeout is set to the global default (10s).

# Alertmanager configuration
alerting:
  alertmanagers:
    - static_configs:
        - targets:
          # - alertmanager:9093

# Load rules once and periodically evaluate them according to the global 'evaluation_interval'.
rule_files:
  # - "first_rules.yml"
  # - "second_rules.yml"

# A scrape configuration containing exactly one endpoint to scrape:
# Here it's Prometheus itself.
scrape_configs:
  # The job name is added as a label `job=` to any timeseries scraped from this config.
  - job_name: "prometheus"
    # metrics_path defaults to '/metrics'
    # scheme defaults to 'http'.
    static_configs:
      - targets: ["ip:port1"]

  - job_name: "server"
    static_configs:
      - targets: ["ip:port2"]

  - job_name: "node"
    static_configs:
- targets: ["ip:port3"] 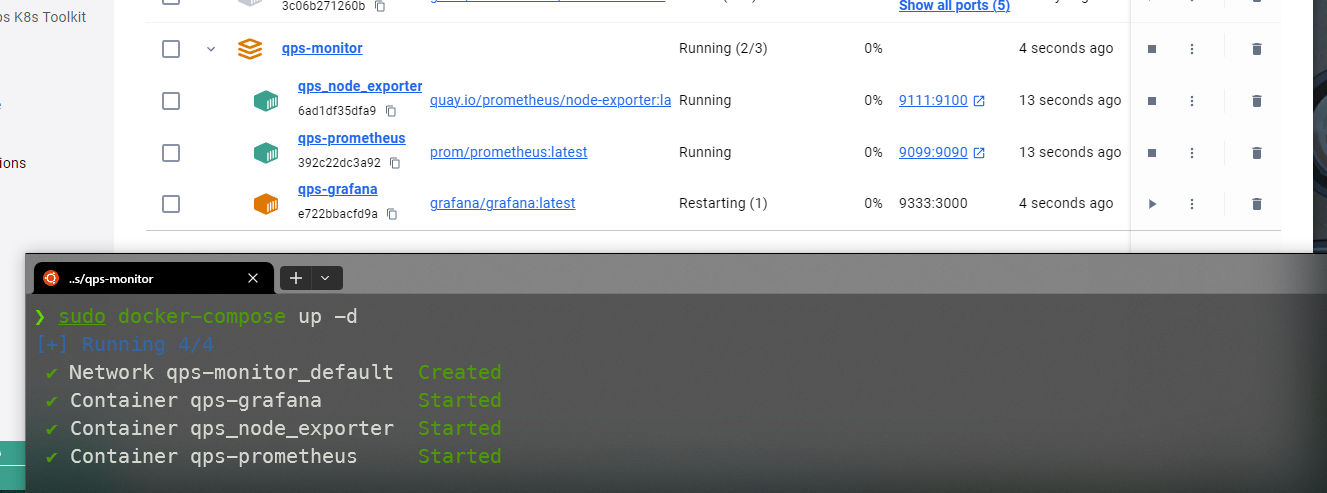
一般遇到grafana一直重启的问题,通常是因为文件权限没有给对,直接777即可,一般来说启动成功的结构如下图:
配置 Grafana
Grafana默认账号密码admin,进去先直接配置数据源。

选择后,在 Prometheus 数据源配置页面,配置这个数据源的 HTTP URL 就可以了。如果你点击“Save & test”按钮后提示成功,那么数据源就配置好了。
接下来,我们再添加一个 node-exporter 仪表板(dashboard),把从 node-exporter 拉取的度量数据以图形化方式展示出来。这个时候我们不需要手工一个一个设置仪表板上的 panel,Grafana 官方有现成的 node-exporter 仪表板可用,我们只需要在 grafana 的 import 页面中输入相应的 dashboard ID,就可以导入相关仪表板的设置:
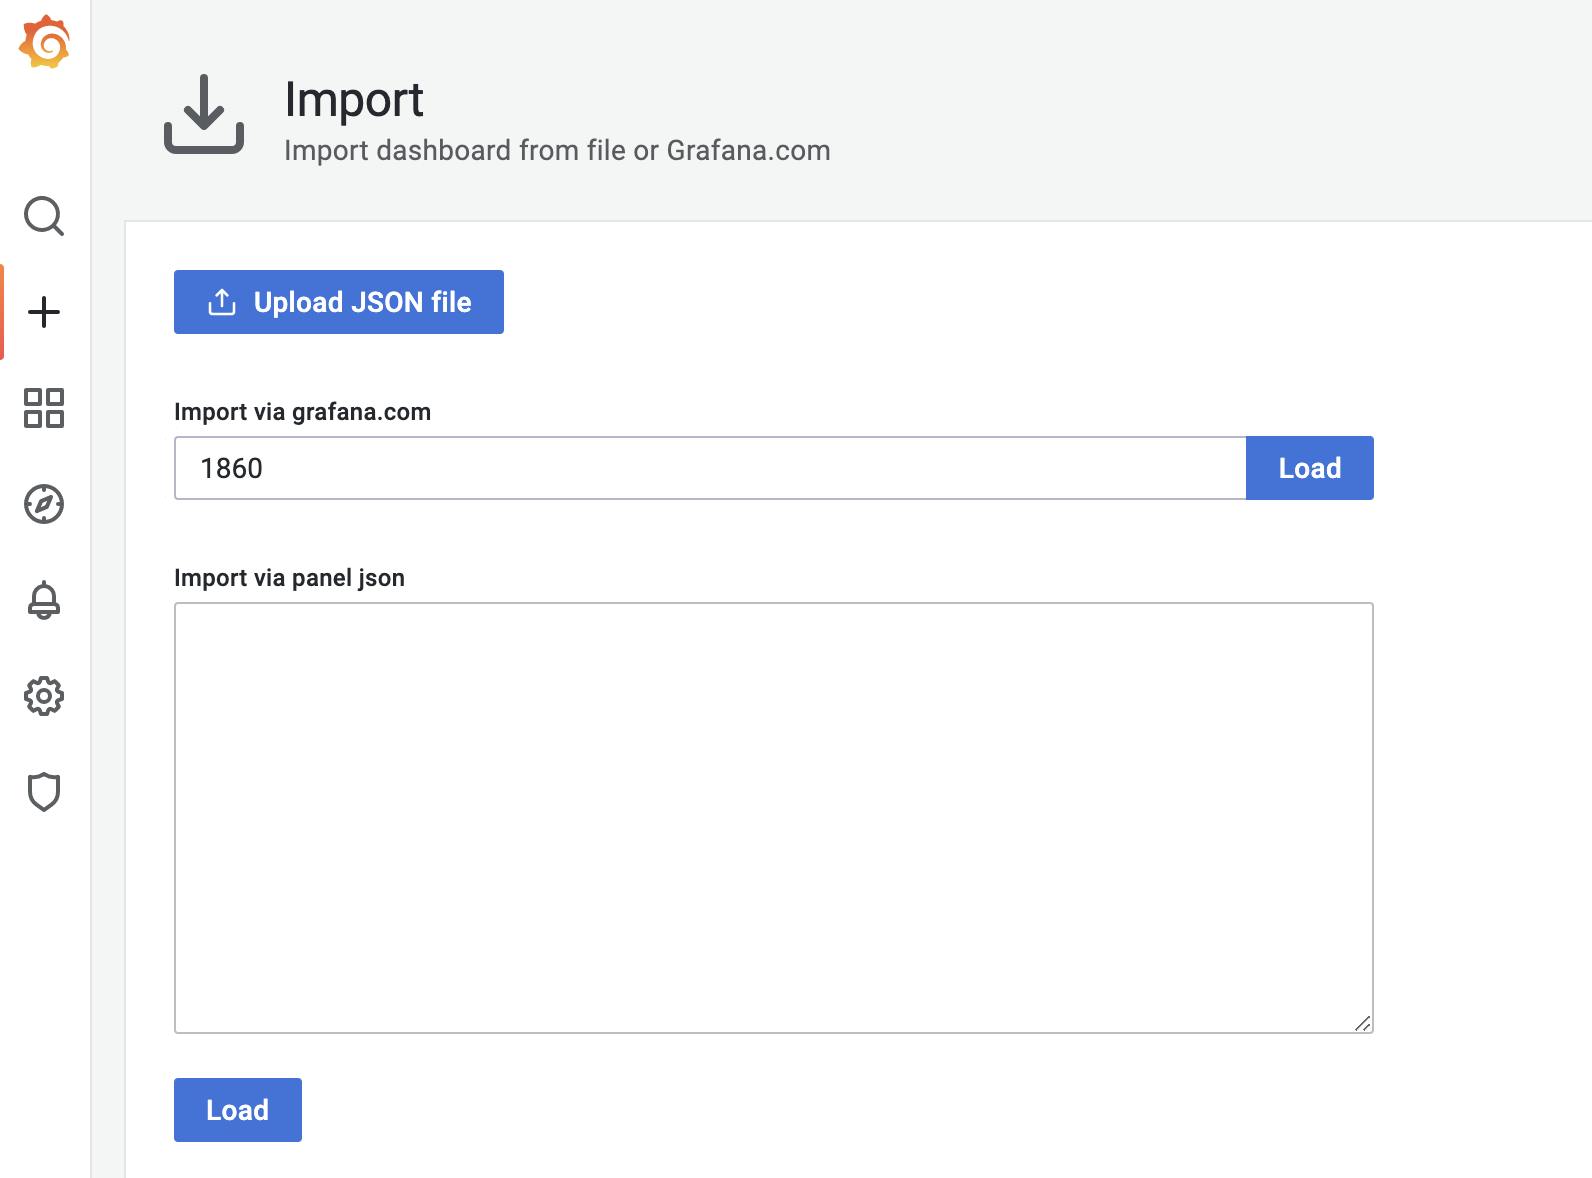
ID 为 1860 的 node-exporter 仪表板,导入成功后,进入这个仪表板页面,等待一段时间后,我们就可以看到类似下面的可视化结果:好了,到这里 node-exporter 的度量数据,已经可以以图形化的形式呈现在我们面前了,至于我们自己的数据怎么添加监控在前面部分就说了。
添加自定义面板
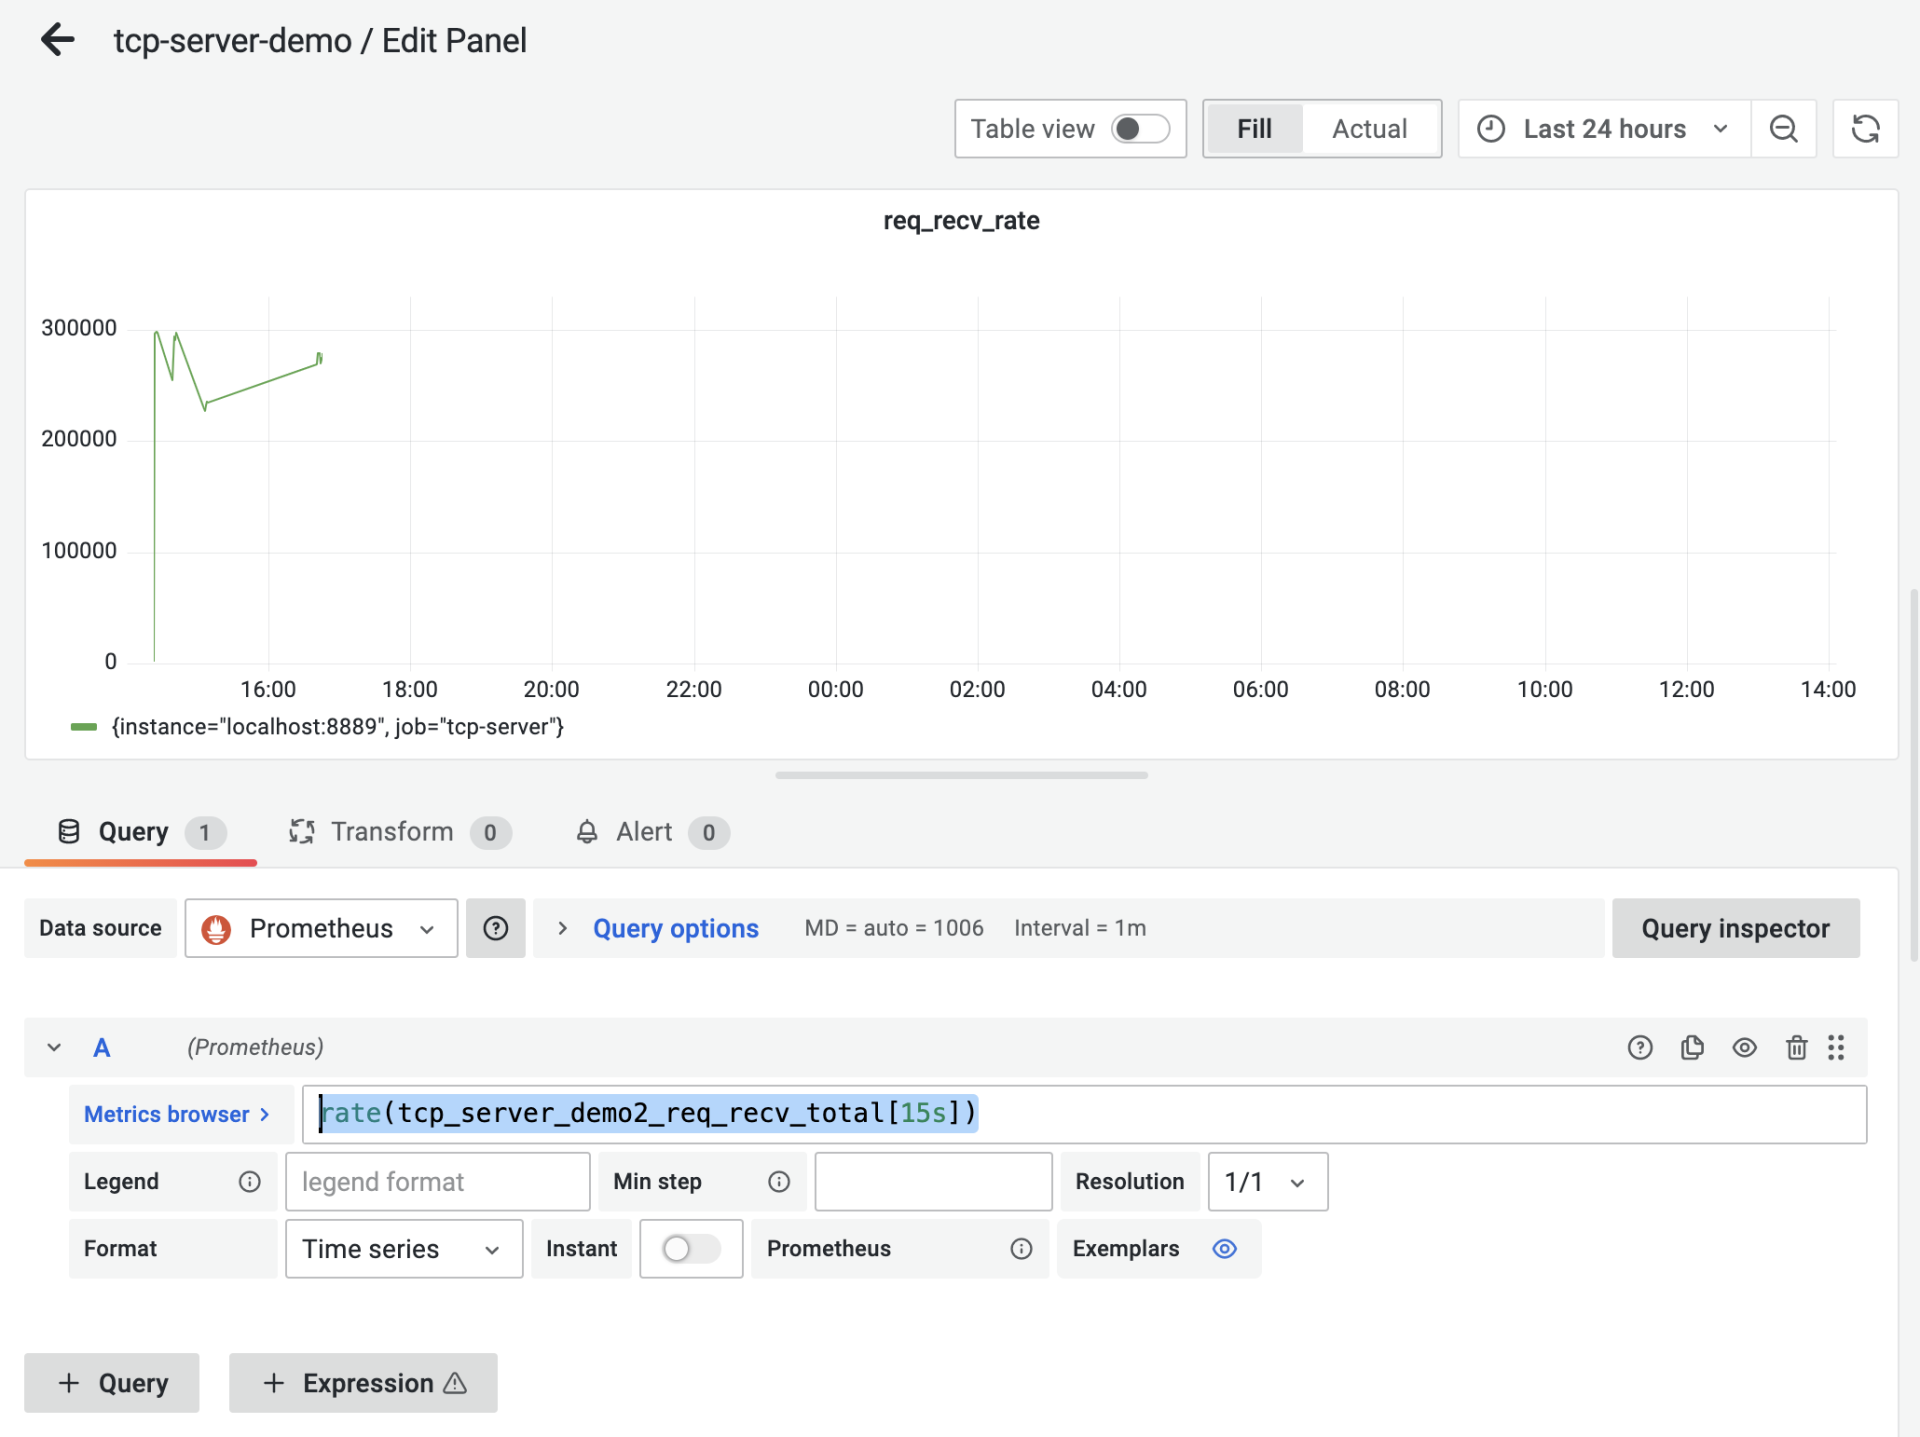
rate是我们测试qps等等跟时间有关的部分最常用的函数。以 req_recv_rate 这个 panel 为例,它的 panel 配置是这样:
 ****
****
我们看到图中的 Metrics Browser 后面的表达式是:rate(tcp_server_demo2_req_recv_total[15s]),这个表达式返回的是在 15 秒内测得的 req_recv_total 的每秒速率,这恰恰是可以反映我们的服务端处理性能的指标。
配置图
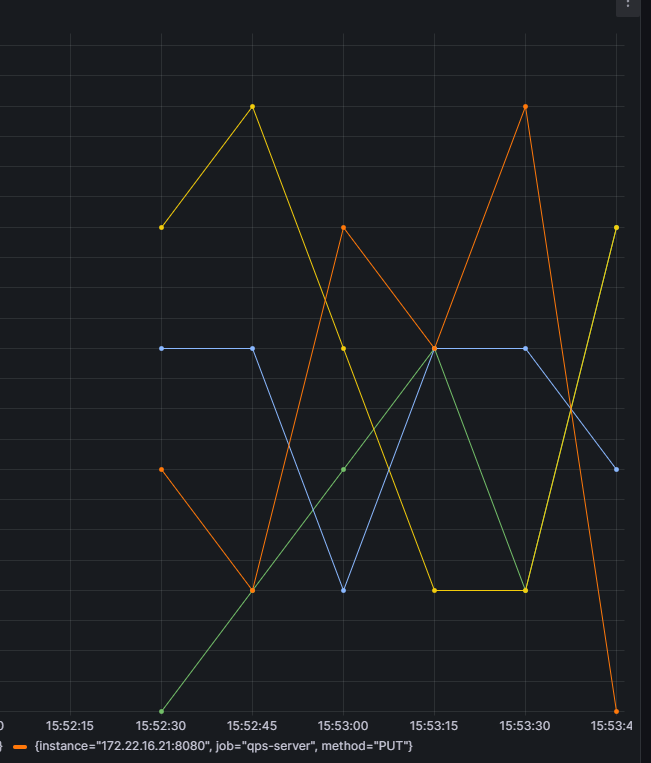
现在可以精准监控了,可喜可贺。
